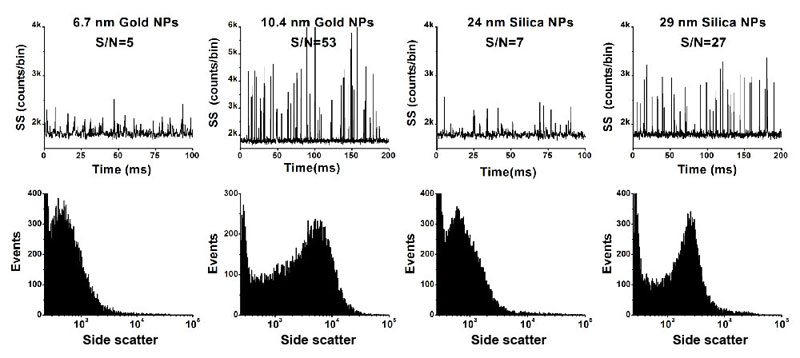
Nano-flow Cytometry is super-sensitive, which allows label free analysis of single silica and gold nanoparticles down to 24 nm and 7 nm, respectively. For viruses, it is able to detect the signals from single MS2 virus (27 nm). Nano-flow cytometry shows a resolution comparable to that of TEM and the throughput of flow cytometric analysis.
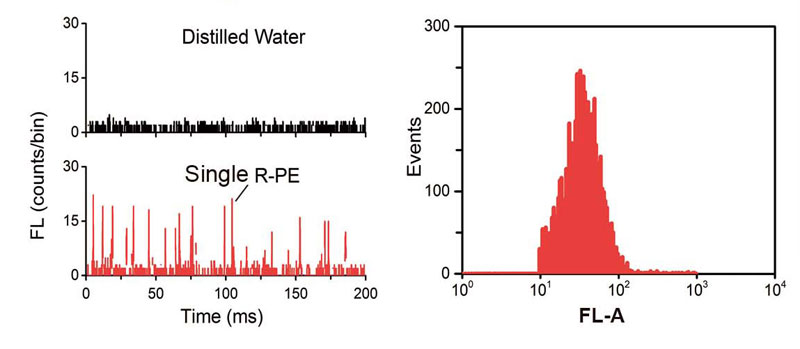
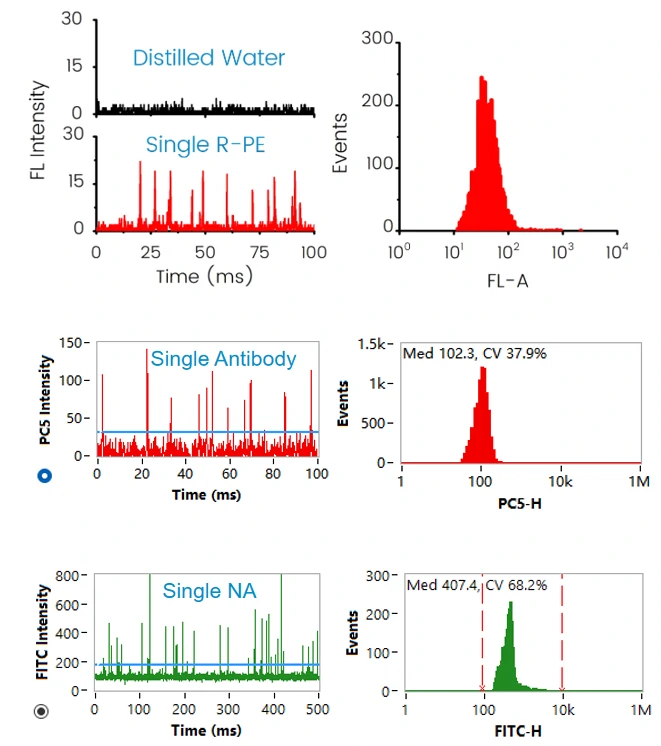
The fluorescent signals from single R-phycoerythrin molecules can be acquired individually by nano-flow cytometry, which means the NanoFCM is able to study EV proteins as low as ONE copy.
The fluorescent signals of mRNA which stained with nucleic acid dye presented single and uniform signal during individually by nano-flow cytometry, which means the NanoFCM is able to analysis signle nucleic acid.
Hundreds of nanoparticles can be detected one by one per second, and a highly representative statistical distribution of particle properties can be obtained in 1 minute.
The real-time burst traces are monitored/collected to ensure the particles are detected individually. The state of the probe volume is monitored in real time.
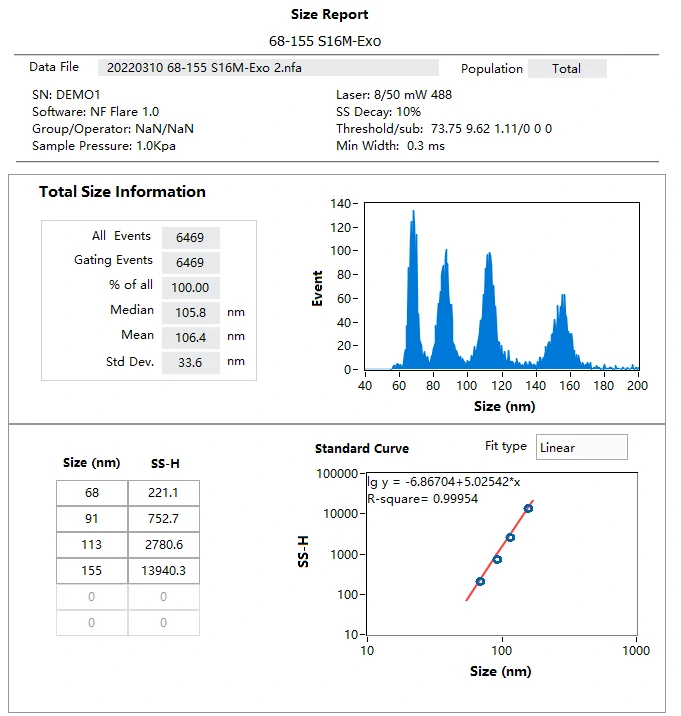
Compared with polystyrene beads (RI=1.59), in nFCM system monodisperse silica nanoparticles (RI=1.46) are employed as the reference to calibrate the size of EVs.
The resolution of NanoFCM is comparable to TEM. Median, mean, and standard deviation value of a sample can be read from the software, parameter of gated population within a sample is also available.
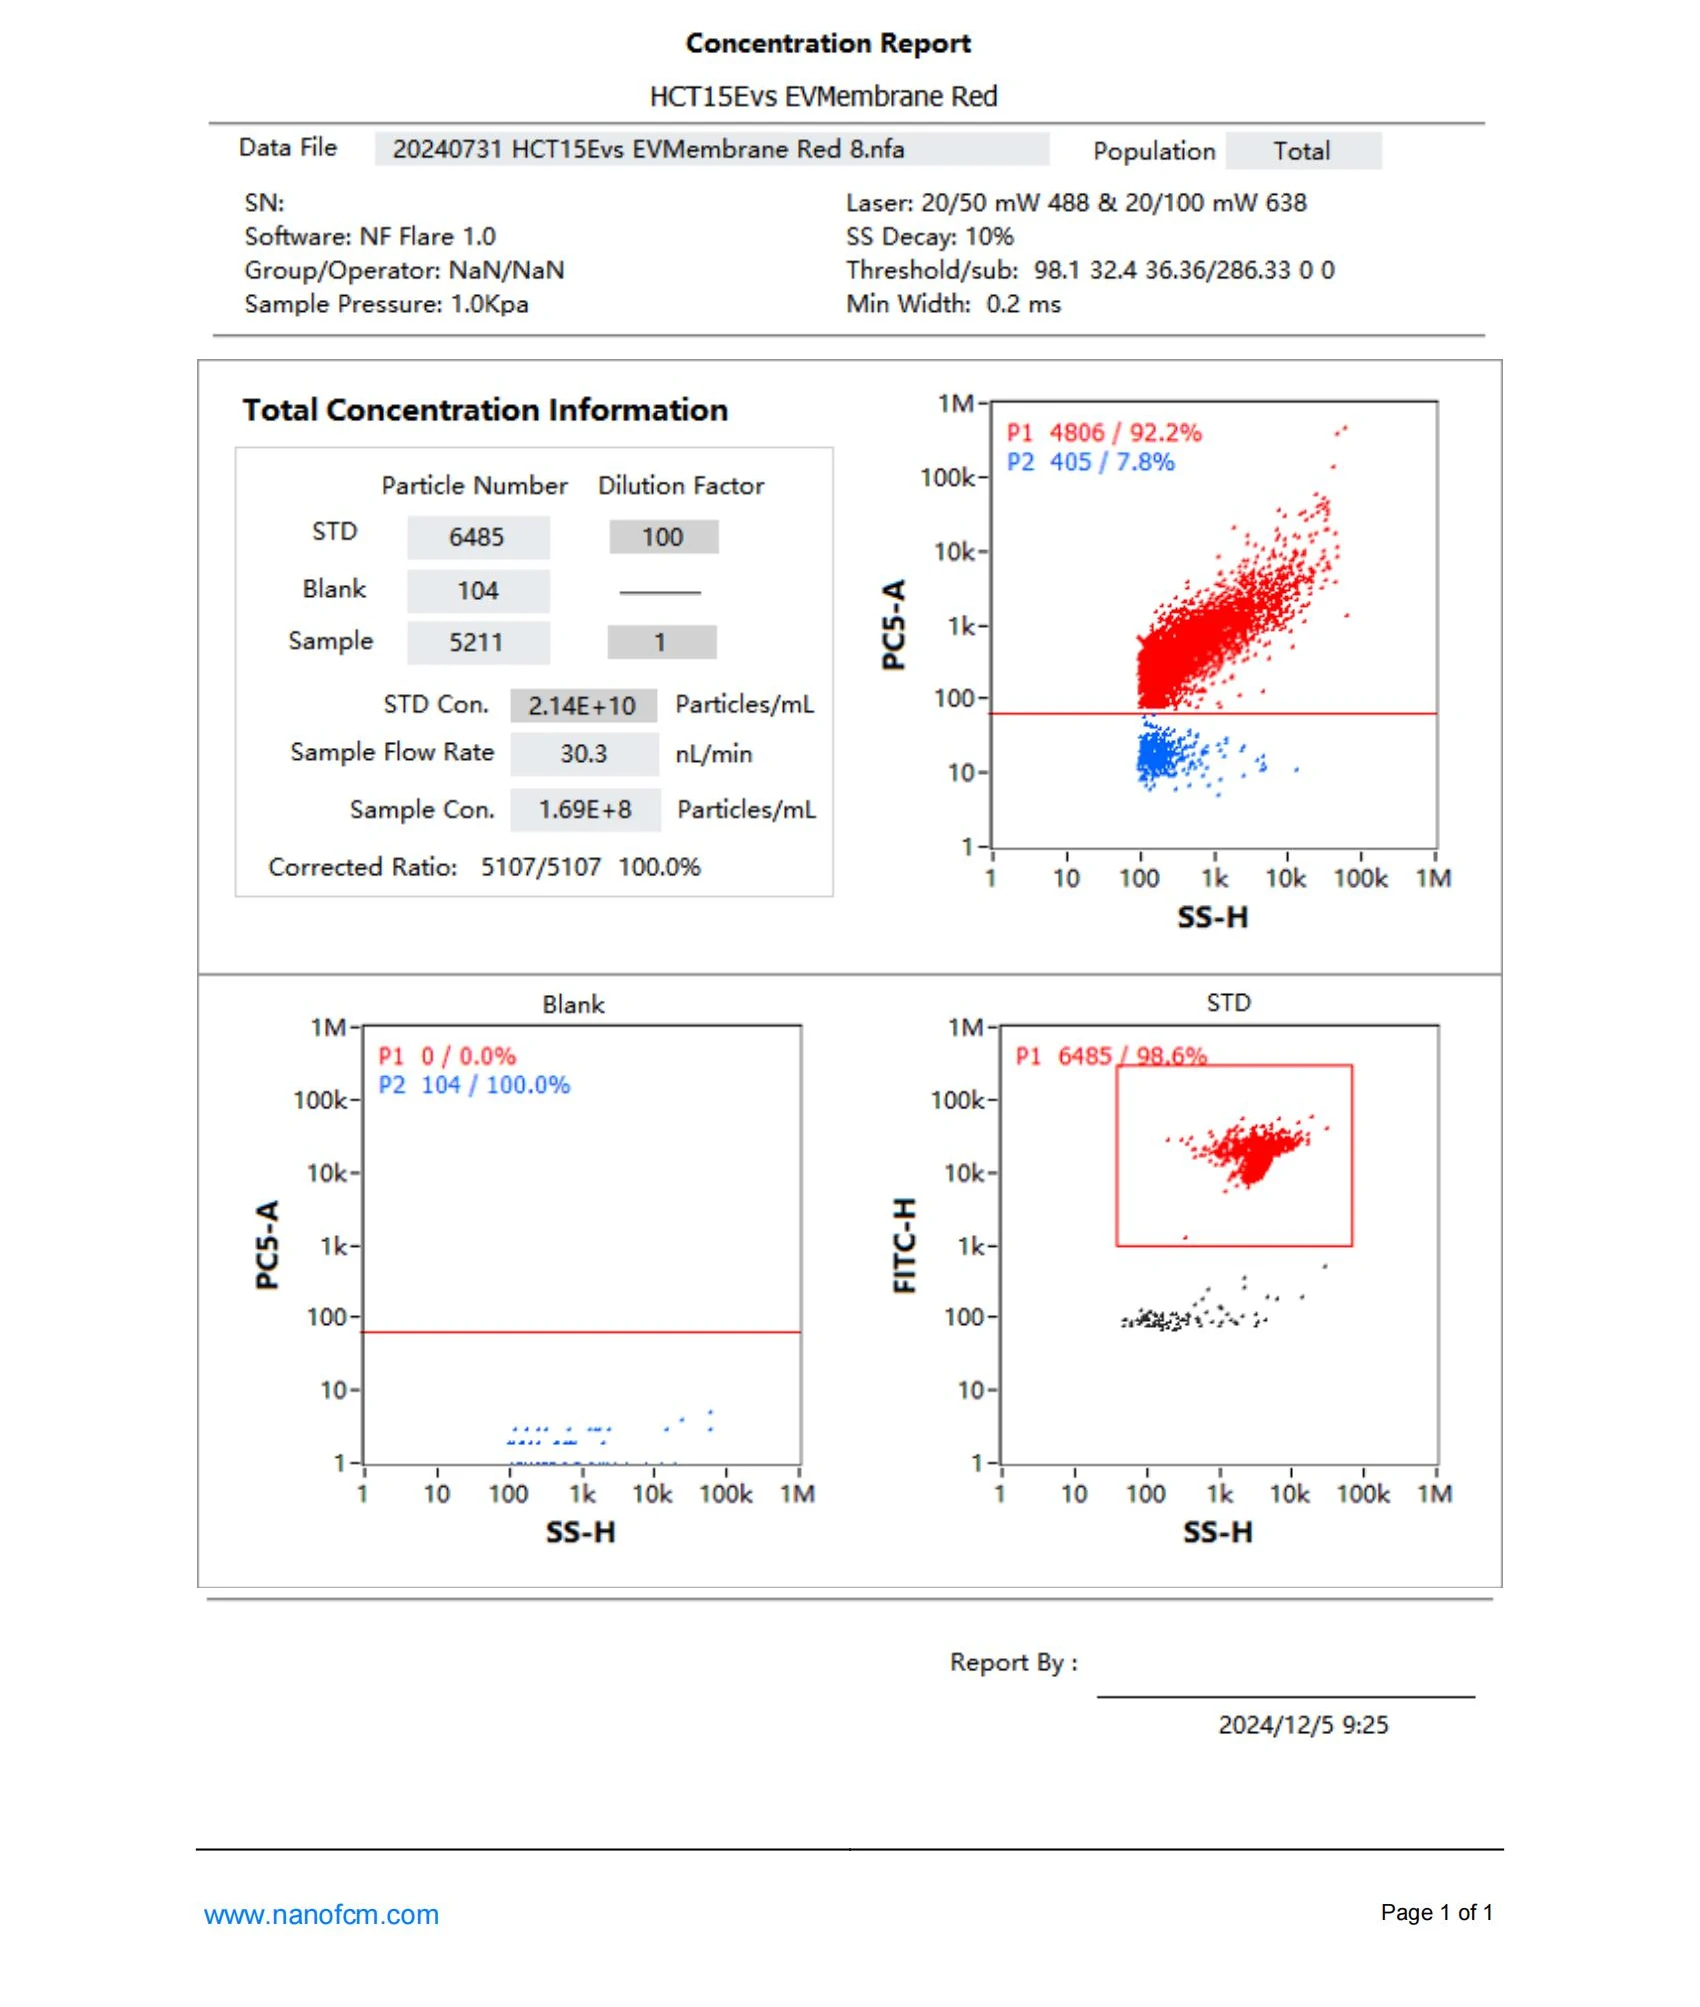
In NanoFCM system, the detection efficiency is 100%, the particle concentration is determined via single particle enumeration. The particle counts collected within given time, particle concentration of whole population as well as subpopulation can be determined, e.g. the ratio of positive. The biochemical function of a subgroup is linked with its size distribution.
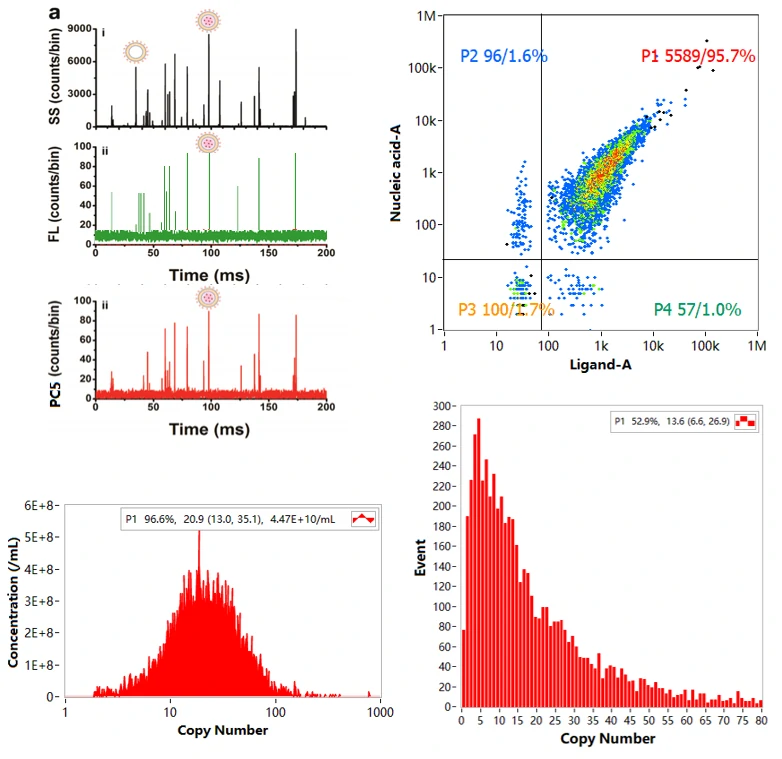
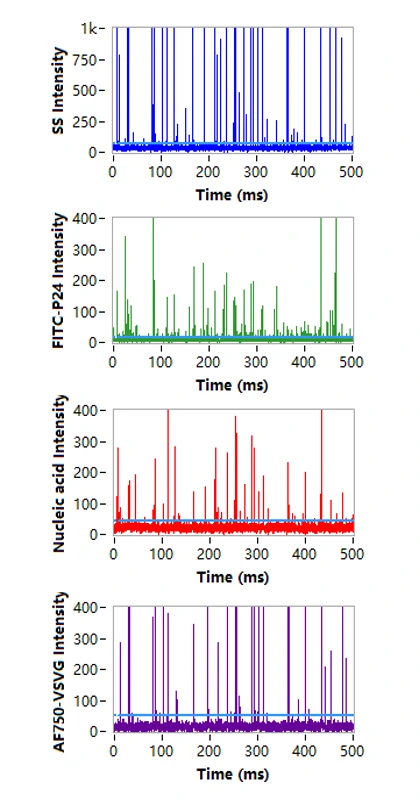
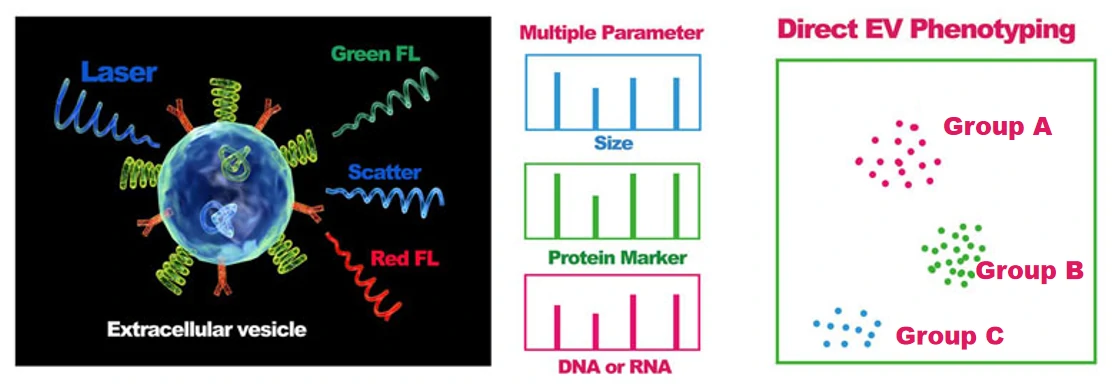
Multiple parameters, including various surface proteins, nucleic acids, lipids and so on can be achieved within a sample simultaneously.
After labeling with fluorescent probes, the fluorescence signals of particals can be detected concurrently with side scatter. By offering quantitatively analysis of single EVs or LNPs with the standard curve which made by fluorescent equivalent standard sphere, the copy number of proteins and payload of engineered EVs or Ligand-modified LNPs can be evaluated individually.
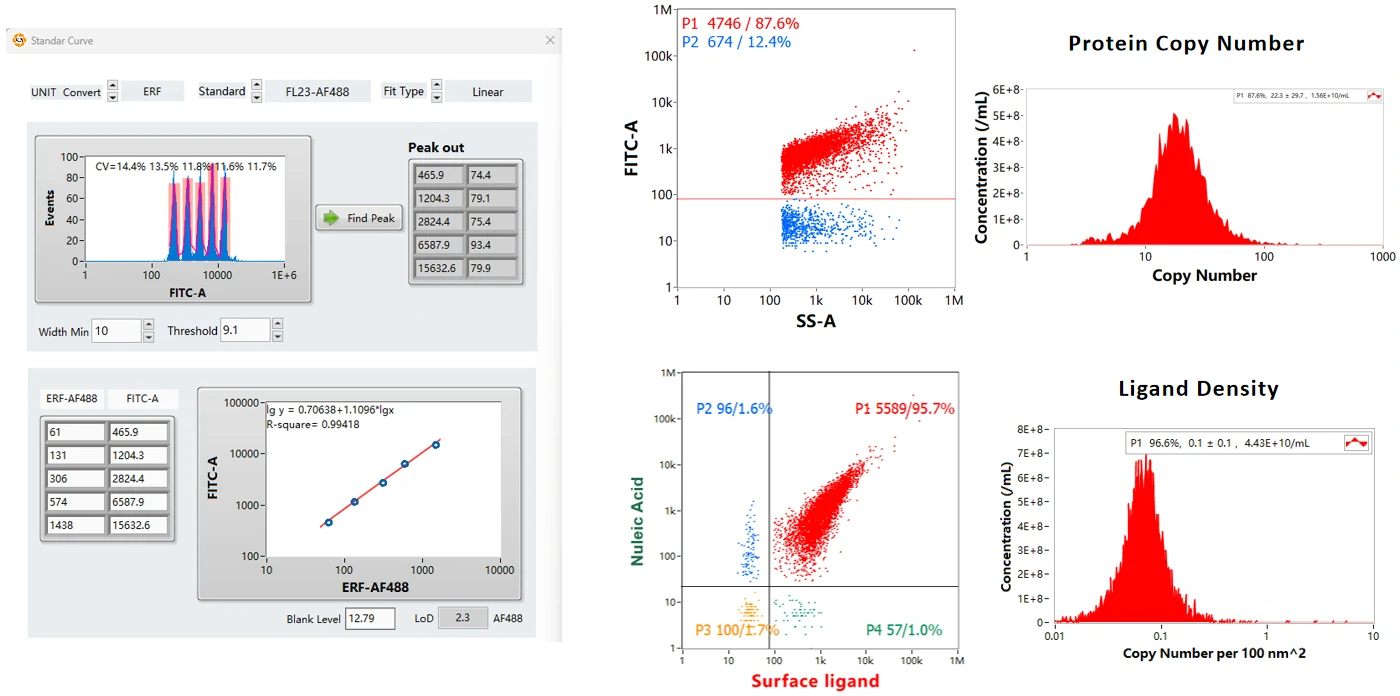
Quantification of the EE of nucleic acid nanomedicines and the copy of the carried nucleic acids and specific proteins in nanomedicine.