Performance
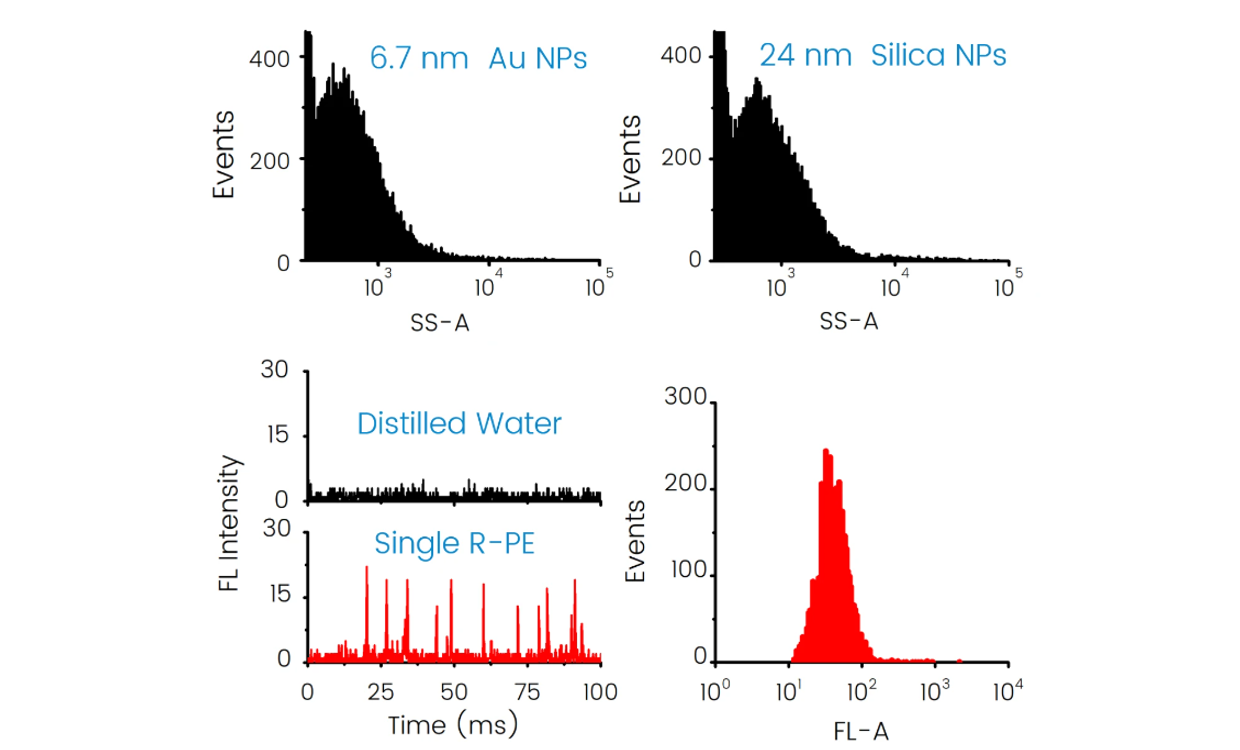
Superior Sensitivity in SS and FL Mearsurement
Employing strategies for single-molecule fluorescence detection in a sheathed flow, Flow NanoAnalyzer enables light scattering detection of single gold and silica nanoparticles as small as 7 and 24 nm in diameter, respectively. For fluorescent detection, single phycoerythrin can be distinguished from the background.

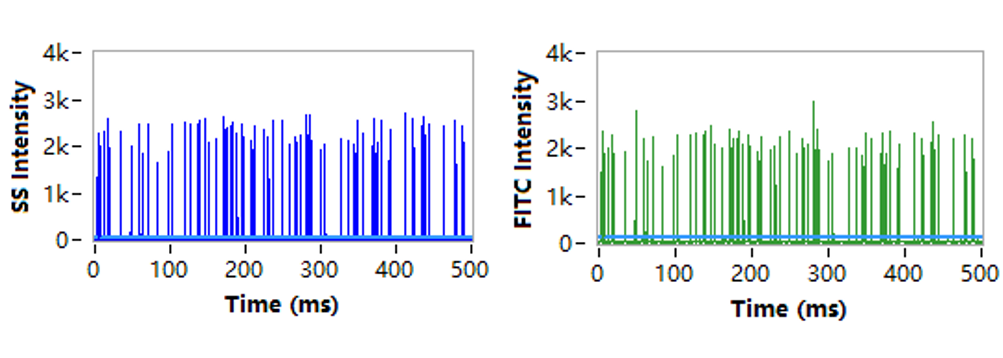
Real-Time Monitor
The real-time burst traces provided the original signals of particles of interest and the background state. These can be used to monitor the status of smaples and prevent swarming detection.

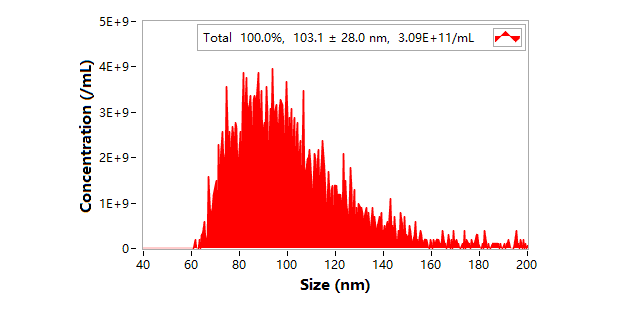
Particle Size Distribution and Concentration Measurement
Based on light scattering measurement of individual nanoparticles, accurate and statistically representative particle size distribution can be acquired in just minutes with a resolution comparable to that of TEM or cryo-TEM. Furthermore, particle concentration can be determined by using single-particle enumeration at the same time.

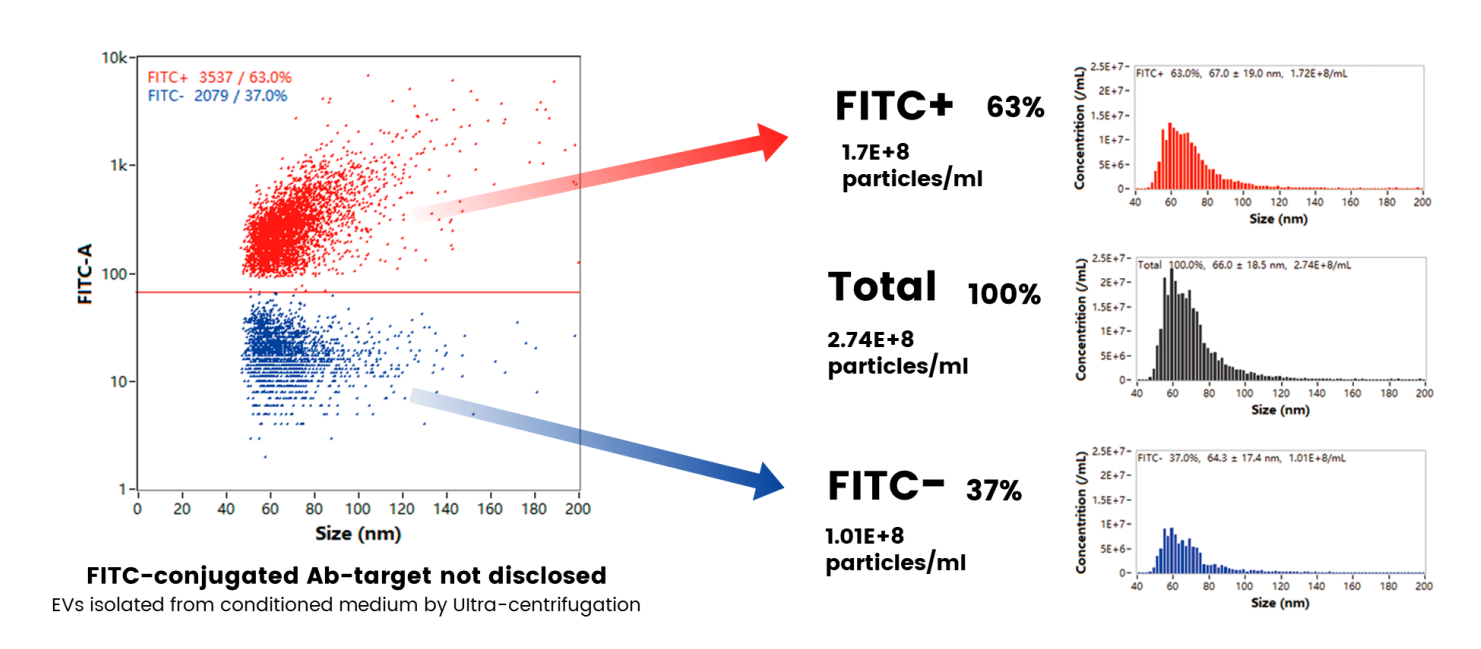
Phenotyping for Subpopulation Identification
Upon fluorescent staining, Flow NanoAnalyzer acheives the analysis of compositions including lipid membrane, nucleic acids and specific proteins of extracellular vesicles, LNPs and viral vectors. This enables scientists to create an objective benchmark to dicipher the heterogenous subpopulations of nanoparticles.


